 Sprelay API
How to Compare LLM API Pricing: Tokens, Caching, and Billing
Most AI API pricing pages show two numbers per model: an input price and an output price, both per million tokens. If you compare models by those two numbers alone, you can pick the wrong one. Your real bill also depends on how much of your input is served from cache, how long the responses are, and how the provider actually charges you.
This guide gives you a repeatable method for a multi-LLM API pricing comparison. It works for any provider. As the worked example, we use Sprelay's public, machine-readable price catalog, so you can re-run the comparison yourself whenever prices change instead of trusting numbers in a blog post.
Short version:
- Convert every price to USD per 1 million tokens, split into four rates: input, output, cache read, and cache write.
- Describe your workload as tokens per request: fresh input, cached input, and output.
- Multiply, add, and compare cost per request (or per completed task), not the list price.
- Pull the rates from a live catalog right before you decide. Prices change often.
Why list prices are misleading
Two models can look close on a pricing page and still produce very different bills. Here are three common reasons:
- Output usually costs several times more than input. A model with cheap input but expensive output is a bad fit for long-form generation.
- Cached input is billed at a fraction of the input rate, and that fraction varies by model. In coding agents and chat apps with long histories, most input tokens can be cache reads. For those workloads the cache-read rate matters more than the headline input price.
- The same text produces different token counts on different models. Each vendor uses its own tokenizer, so "per million tokens" is not exactly the same unit across vendors.
So the useful question is not "which model has the lowest price per million tokens?" It is "which model is cheapest for my traffic?"
Step 1: Normalize every rate to price per million tokens
Pricing pages use different units: per 1K tokens, per 1M tokens, ratios, credits, or multipliers. Convert everything to USD per 1M tokens before you compare.
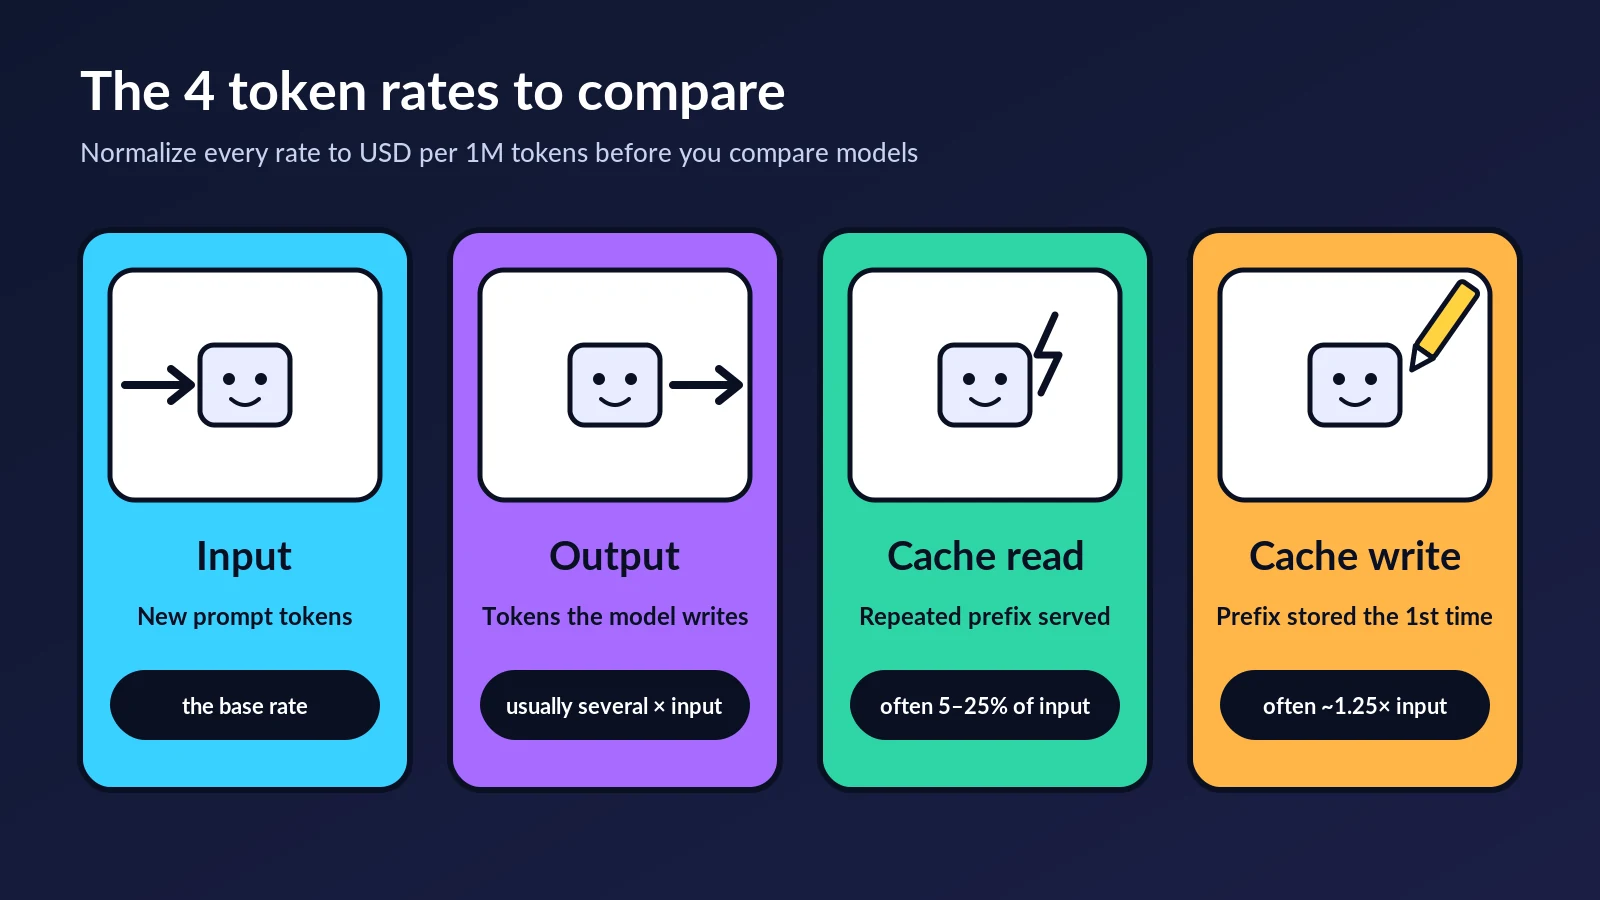
| Rate | What it covers | How to normalize |
|---|---|---|
| Input | Prompt tokens you send that are not served from cache: system prompt, user message, tool results | Per 1K price × 1,000 = per 1M price |
| Output | Tokens the model generates, including reasoning/thinking tokens on models that bill them as output | Usually shown as a multiple of input |
| Cache read | Input tokens that hit a prompt cache | Usually a fraction of the input rate (often 5–25%) |
| Cache write | Input tokens written into the cache the first time | Usually a premium over input (often 1.25× or more), or not charged at all |
Some models are not billed by tokens at all. Image models are often priced per request or per image. Keep those in a separate comparison. You can't put a per-image price on the same scale as a per-token price.
Step 2: Describe your workload in tokens
Pick a representative request and split its tokens into three buckets:
- Fresh input: new tokens in this request (the user's message, new tool output).
- Cached input: the repeated prefix (system prompt, documents, earlier conversation) that the provider serves from cache.
- Output: what the model writes back.
Don't guess these numbers. Run 50–100 real requests and read the token counts from the API response or from your provider's usage logs. Most APIs return input, output, and cached token counts on every response.
Here are some typical shapes:
| Workload | Fresh input | Cached input | Output |
|---|---|---|---|
| Short chatbot reply | 500 | 2,000 | 300 |
| Document summary (no reuse) | 8,000 | 0 | 800 |
| Long-form writing | 2,000 | 0 | 4,000 |
| Coding agent turn | 2,000 | 50,000 | 500 |
Step 3: Calculate cost per request
The formula is the same for every model:
cost per request =
    fresh_input  / 1,000,000 × input_price
  + cached_input / 1,000,000 × cache_read_price
  + cache_write  / 1,000,000 × cache_write_price
  + output       / 1,000,000 × output_price
Multiply by your monthly request volume, then add a 20–30% buffer for retries, longer-than-expected answers, and traffic spikes.
To compare models with one number, you can also compute an effective price per million tokens: total cost divided by total tokens (in millions). It shows what you really pay per token for a given workload, after caching and output length are taken into account.
When does caching pay off?
If a provider charges a premium to write the cache, caching only saves money after enough cache reads. Here is the break-even check:
extra cost of writing   = cached_tokens × (cache_write_price − input_price)
savings per later read  = cached_tokens × (input_price − cache_read_price)
With a typical 1.25× write and 0.1× read, the write premium is 0.25× input and each re-read saves 0.9× input. Caching pays for itself on the first reuse. It loses money only when a cached prefix is never read again before it expires.
Step 4: Use a live price catalog, not a screenshot
AI API pricing changes all the time. New models launch, old ones get discounted, and relay platforms adjust group rates. Any table of prices in a blog post, including this one, starts going stale the day it's published.
The fix is to pull prices from a machine-readable source when you compare. Sprelay publishes its full catalog as public JSON at sprelaytoken.com/api/pricing. The same data is shown in human-readable form on the pricing page, with a detail page for each model (for example, /pricing/claude-sonnet-5-5).
How to read the catalog
Each model in the data array includes these fields:
| Field | Meaning | Converts to |
|---|---|---|
model_ratio |
Base input rate | model_ratio × $2 = input USD per 1M tokens |
completion_ratio |
Output rate relative to input | input price × completion_ratio = output price |
cache_ratio |
Cache-read rate relative to input | input price × cache_ratio = cache-read price |
create_cache_ratio |
Cache-write rate relative to input (only listed for some models) | input price × create_cache_ratio = cache-write price |
enable_groups |
Pricing groups the model is available in | — |
quota_type |
0 = billed per token, 1 = flat price per request (model_price) |
— |
The top-level group_ratio object holds a multiplier for each pricing group. The final price is the base price × the group multiplier. The same model can therefore cost different amounts depending on the group your API key uses.
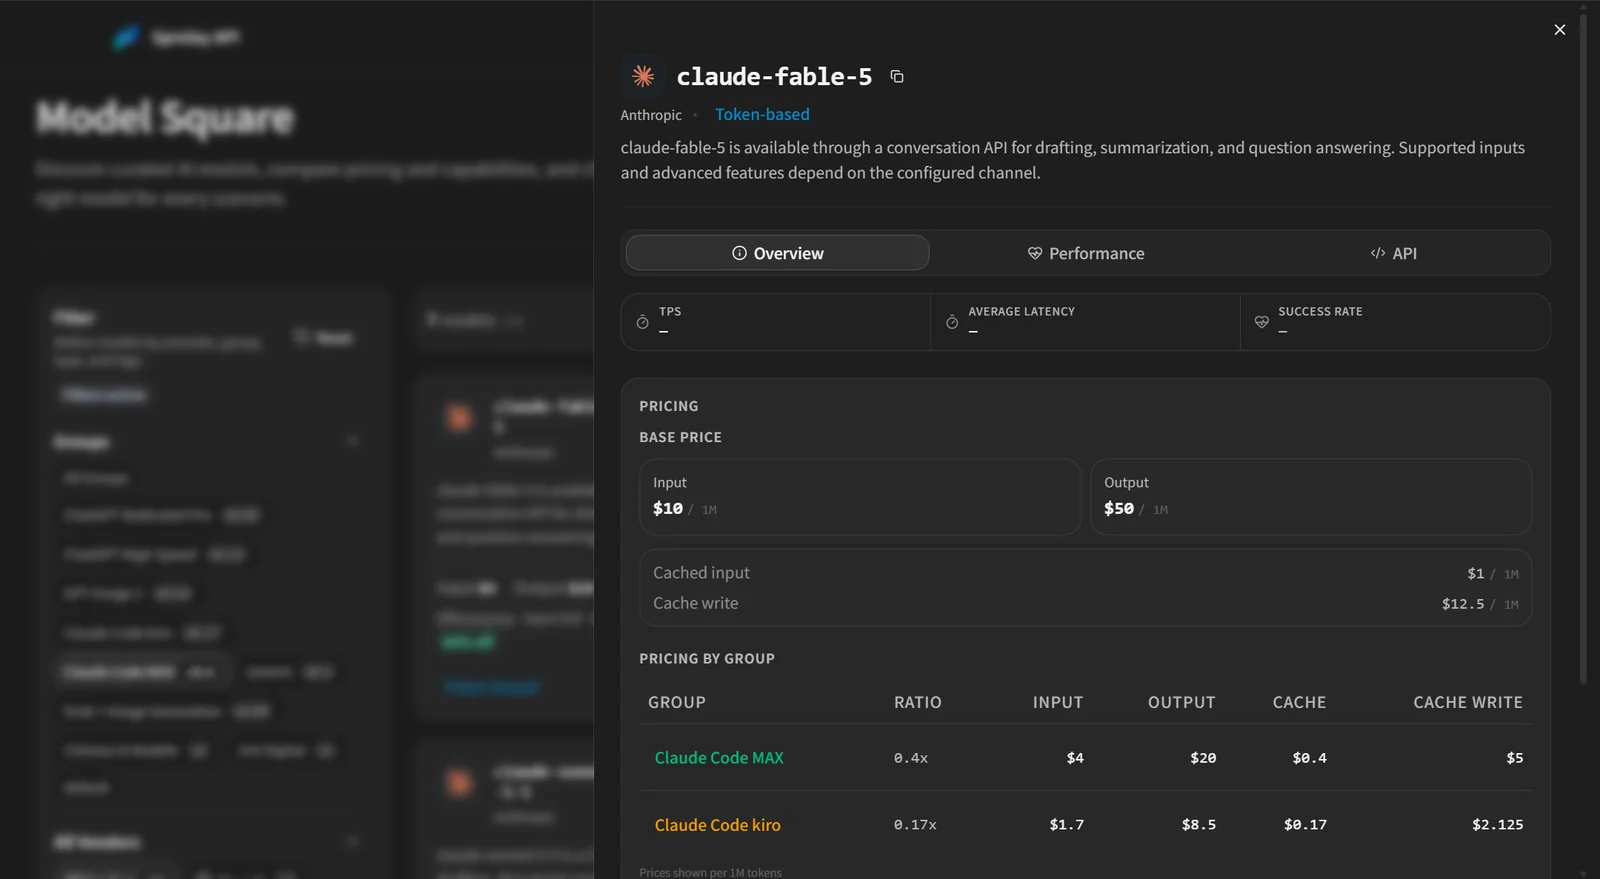
The claude-fable-5 detail page on Sprelay: one base price, then a different input, output, cache-read, and cache-write rate for each pricing group.
Worked example (claude-sonnet-5-5, catalog snapshot from November 12, 2026): model_ratio 1, completion_ratio 5, cache_ratio 0.05, create_cache_ratio 1.25.
- Base input: 1 × $2 = $2.00 per 1M tokens
- Output: $2.00 × 5 = $10.00
- Cache read: $2.00 × 0.05 = $0.10
- Cache write: $2.00 × 1.25 = $2.50
- In the Claude Code MAX group (multiplier 0.4): $0.80 / $4.00 / $0.04 / $1.00
You don't have to do this by hand.
A script that compares models from live prices
This Python script uses only the standard library. It fetches the current catalog, applies the group multipliers, and prices your workload on every model you list:
import json, urllib.request

URL = "https://sprelaytoken.com/api/pricing"
MODELS = ["claude-sonnet-5-5", "gpt-5.6-sol", "gemini-3.5-flash", "deepseek-v4-flash"]

# Your workload, per request
FRESH_INPUT = 2_000    # uncached input tokens
CACHED_INPUT = 50_000  # input tokens served from cache
OUTPUT = 500           # output tokens (including any reasoning tokens)
REQUESTS = 1_000

req = urllib.request.Request(URL, headers={"User-Agent": "price-check"})
catalog = json.load(urllib.request.urlopen(req))
group_ratio = catalog["group_ratio"]

for m in catalog["data"]:
    if m["model_name"] not in MODELS or m["quota_type"] != 0:
        continue  # quota_type 1 = flat price per request (e.g. image models)
    base_in = m["model_ratio"] * 2  # USD per 1M input tokens before group multiplier
    for g in m["enable_groups"]:
        if g not in group_ratio:
            continue
        inp = base_in * group_ratio[g]
        out = inp * m["completion_ratio"]
        cache_read = inp * m.get("cache_ratio", 1)
        cost = REQUESTS * (FRESH_INPUT * inp + CACHED_INPUT * cache_read + OUTPUT * out) / 1e6
        print(f"{m['model_name']:<20} {g:<20} in ${inp:.3f}  out ${out:.3f}  "
              f"cache read ${cache_read:.4f}  -> ${cost:.2f} per {REQUESTS:,} requests")
Change MODELS and the three token counts to match your traffic, then run it again whenever you need a fresh comparison. If a model doesn't list a cache_ratio, the script treats cached input as normal input, which is the conservative assumption. Check the model's pricing page if caching matters for your decision.
Example: caching can flip the ranking
Here is what the method shows when you compare two models on the same workload. The rates come from the catalog snapshot on November 12, 2026. They are here to illustrate the method, not to serve as a price list. For current numbers, run the script above or check the pricing page.
| Snapshot rates (per 1M tokens) | Input | Output | Cache read |
|---|---|---|---|
| claude-sonnet-5-5, Claude Code MAX group | $0.80 | $4.00 | $0.04 |
| gpt-5.6-sol, ChatGPT High-Speed group | $0.65 | $3.90 | $0.065 |
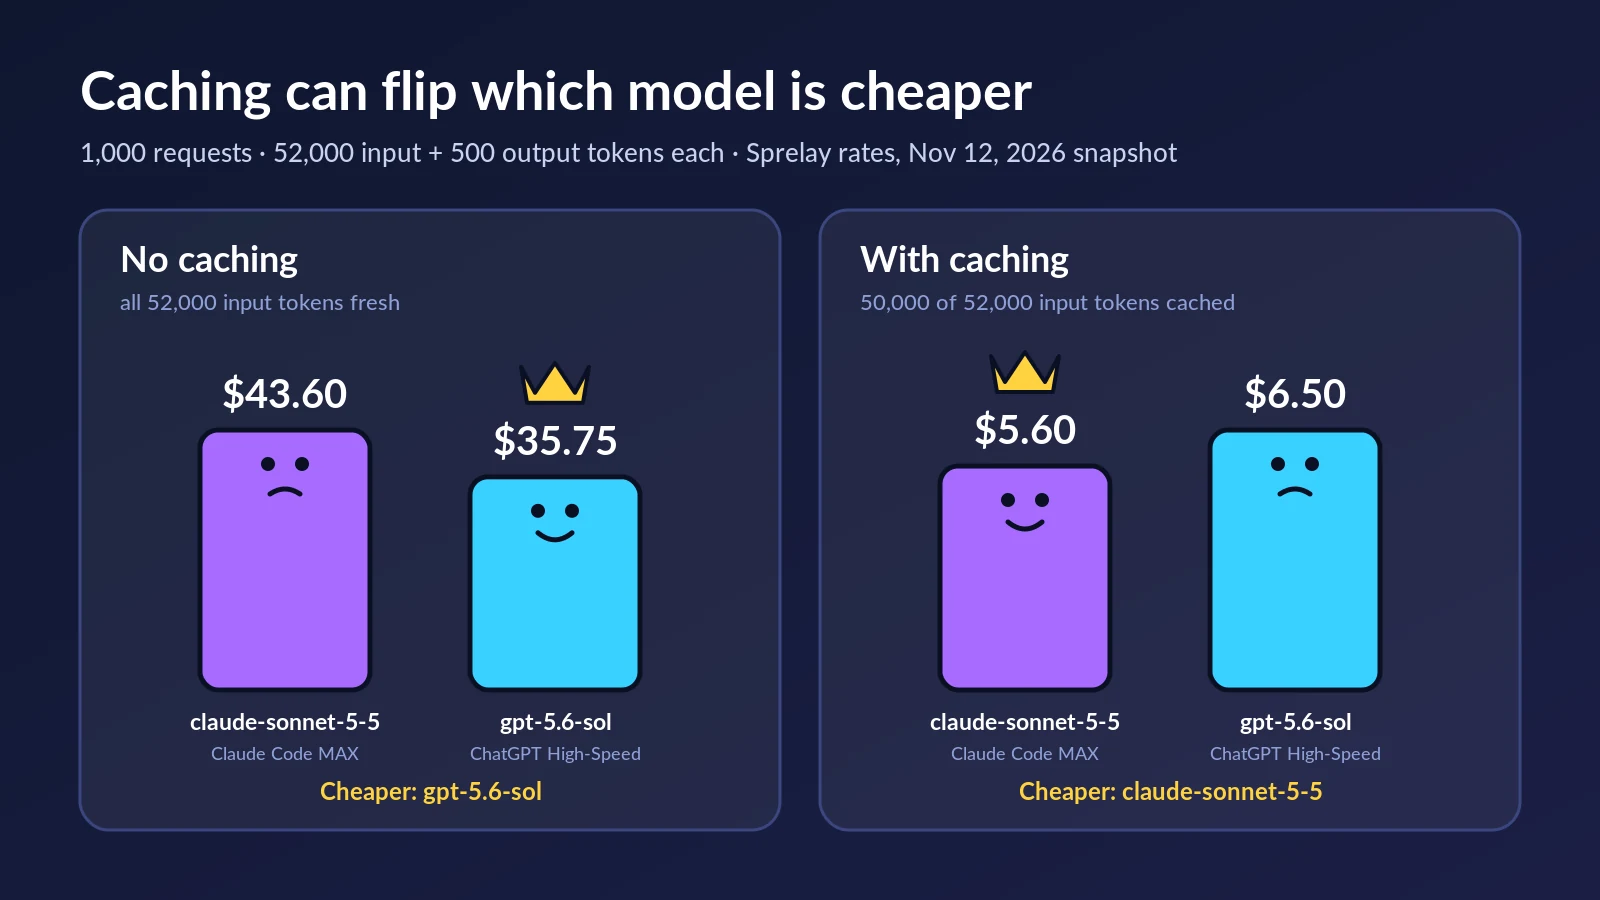
On the list, gpt-5.6-sol is cheaper on both input and output. Now run a coding-agent workload: 52,000 input tokens and 500 output tokens per request, 1,000 requests.
| Scenario | claude-sonnet-5-5 (MAX) | gpt-5.6-sol (High-Speed) | Cheaper |
|---|---|---|---|
| No caching: all 52,000 input tokens fresh | $43.60 | $35.75 | gpt-5.6-sol |
| 50,000 of 52,000 input tokens cached | $5.60 | $6.50 | claude-sonnet-5-5 |
The math for the cached row:
claude-sonnet-5-5: (2,000 × 0.80 + 50,000 × 0.04  + 500 × 4.00) / 1M × 1,000 = $5.60
gpt-5.6-sol:       (2,000 × 0.65 + 50,000 × 0.065 + 500 × 3.90) / 1M × 1,000 = $6.50
Same two models, same request size, and the opposite winner. The cache-read rate decided it. That's why a reliable multi-LLM API pricing comparison has to model your workload: two columns on a price list are not enough.
Price is also only one input. Before you switch, check output quality, latency, context window, and tool-calling behavior on your own tasks.
Billing details to check before you commit
Token rates are only part of the cost. Check these billing terms too:
- Billing model. Pay-as-you-go balance, monthly subscription, or committed spend? Is there a minimum top-up, and does unused balance expire?
- Payment methods. Can you pay with a method that works for you and your team?
- Reasoning tokens. On models that "think" before answering, are those tokens billed as output? They can be several times larger than the visible answer.
- Cache rules. Is caching automatic or opt-in? How long do cached prefixes live, and is there a minimum prefix size?
- Per-request models. Image and some media models charge per call. Compare them per output, not per token.
- Usage visibility. Can you see tokens and cost per request? Without per-request data, you can't check your estimate against your actual bill.
- Group or tier multipliers. On relay platforms, confirm which pricing group your API key uses. The same model can have several prices.
How Sprelay bills
- Pay-as-you-go: you top up a balance and each request is charged against it. There is no subscription.
- Minimum top-up: $5.
- Payment: PayPal or USDT.
- Usage dashboard: shows request count, quota used, tokens, RPM, and TPM, so you can compare your estimates with real spend.
- Pricing groups: every model lists its groups and multipliers on the pricing page and in the JSON catalog.
Checklist: a multi-LLM API pricing comparison in 10 minutes
- List the 3–5 models that pass your quality bar.
- Pull current input, output, cache-read, and cache-write rates from a live source.
- Normalize every rate to USD per 1M tokens and apply any group or tier multiplier.
- Measure fresh input, cached input, and output tokens from real requests.
- Calculate cost per request, then per completed task (count retries and multi-step calls).
- Run the numbers twice: with your expected cache hit rate and with no caching.
- Add a 20–30% buffer and check the billing terms above.
- Re-run the comparison when prices change. With a script, it takes seconds.
Frequently Asked Questions
What does "price per million tokens" mean?
It is the cost in USD for 1,000,000 tokens of a given type (input, output, or cached). A token is a chunk of text, roughly ¾ of an English word on average, though the exact split depends on the model's tokenizer. To convert a per-1K price, multiply it by 1,000.
Why are output tokens more expensive than input tokens?
Generating text is more compute-intensive than reading it, so most providers price output at several times the input rate. For writing-heavy workloads, the output price usually dominates the bill.
How much does prompt caching save?
Cache reads are typically billed at 5–25% of the normal input rate. The savings depend on how much of each request is a repeated prefix and on how often that prefix is reused before it expires. For long-context chat and coding agents, caching often cuts input cost by more than half.
Is the cheapest model per token the cheapest overall?
Not always. As the example above shows, a model with higher list prices can be cheaper when its cache-read rate is lower and most of your input is cached. A model that needs more retries or longer outputs to finish a task can also cost more per completed task.
Where can I see current AI API pricing for every model on Sprelay?
On the pricing page, with a detail page per model, or as raw JSON at sprelaytoken.com/api/pricing if you want to automate comparisons.
How do I compare a specific model in depth?
Run the method above on that model's rates, then compare the result with official pricing. For a full single-model breakdown with real usage data, see our Claude Fable 5 price guide.
Key Takeaways
- Compare four rates per model: input, output, cache read, and cache write, all normalized to USD per 1M tokens.
- Model your workload as fresh input, cached input, and output tokens, measured from real requests.
- Compare cost per request or per task, not list prices. Caching can flip which model is cheaper.
- Pull prices from a live catalog when you decide. Published price tables go stale fast.
- Check the billing terms: payment methods, minimums, reasoning tokens, cache rules, and usage visibility.
Ready to run your own comparison? Check the live rates on the Sprelay pricing page →, then create an account → and top up from $5 with PayPal or USDT to measure real costs on your own workload.